WikiMath
This is Wordpress NewsPaper Theme converted to PmWiki
Histogrammes
Le code
  >>> from pyx import *
  >>> g = graph.graphxy(width=8, x=graph.axis.bar())
  >>> g.plot(graph.data.file("minimal.dat", xname=0, y=2),
             [graph.style.bar()])
  >>> g.writeEPSfile("minimal")
  >>> g.writePDFfile("minimal")
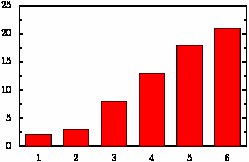
où minimal.dat est le fichier texte :
  # minimal.dat
  1  2
  2  3
  3  8
  4  13
  5  18
  6  21
Son résultat est :
Si l'on préfère une liste à un fichier de données :
  >>> liste = [(1,3),(2,4),(3,1),(4,4)]
  >>> g.plot(graph.data.points(liste, xname=0, y=2),[graph.style.bar()])